Rablashijupa Website
Website for our ADA project
Impact of COVID-19 on Wikipedia Pageviews: A Comparative Analysis”
In order to evaluate how much covid affected people’s interest, it is necessary to compare data before and during the pandemic. We therefore take the assumption that school closure’s date for each country represents the beginning of the pandemic and consequently the lockdown.

Changes in Wikipedia Subtopic Interest During COVID-19
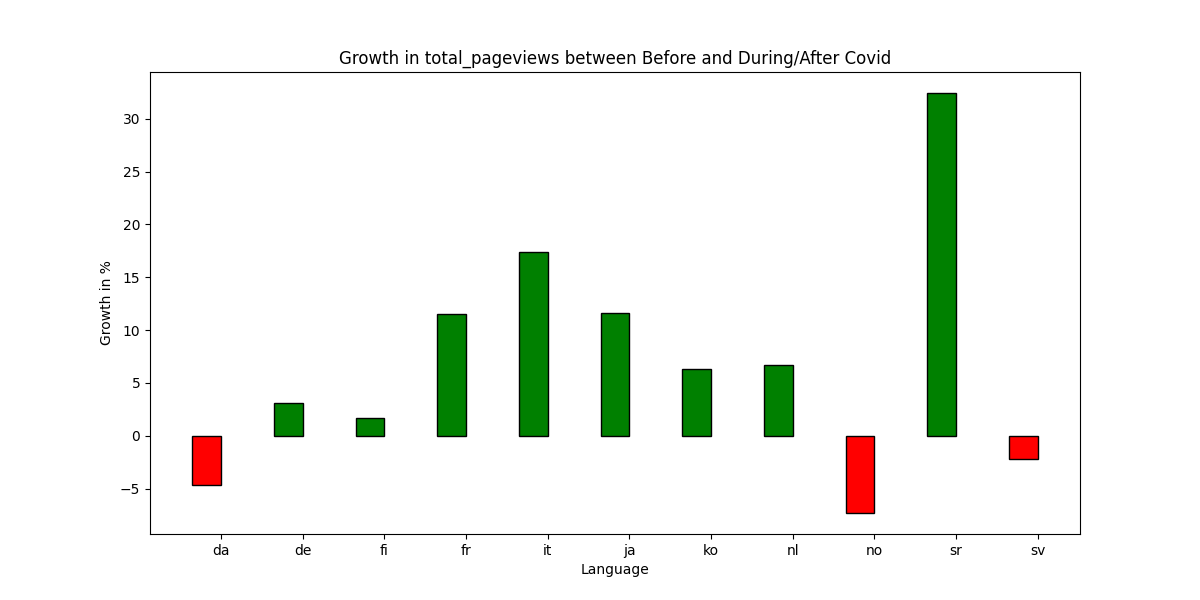
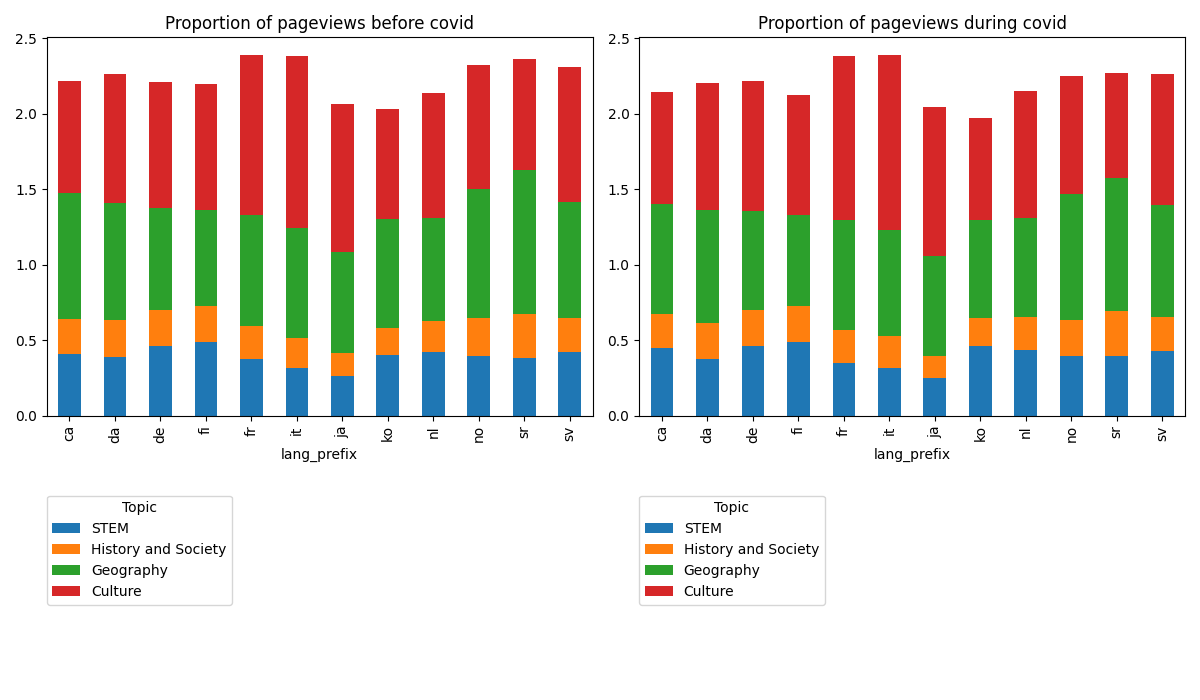
Our first plot shows that there were more pageviews on Wikipedia during the pandemic, in most countries. This makes sense as people were mostly at home and on their computers. The only countries that registered less pageviews during the pandemic are the three scandinavian countries : Denmark, Norway and Sweden. These three countries had short lockdown, which could explain why they didn’t register a growth in Wikipedia pageviews as people spent more time outside when the lockdown ended. Moreover, we can notice that the proportion of pageviews is bigger than 1, this is due to the fact that wikipedia pages can be linked with multiple topics.
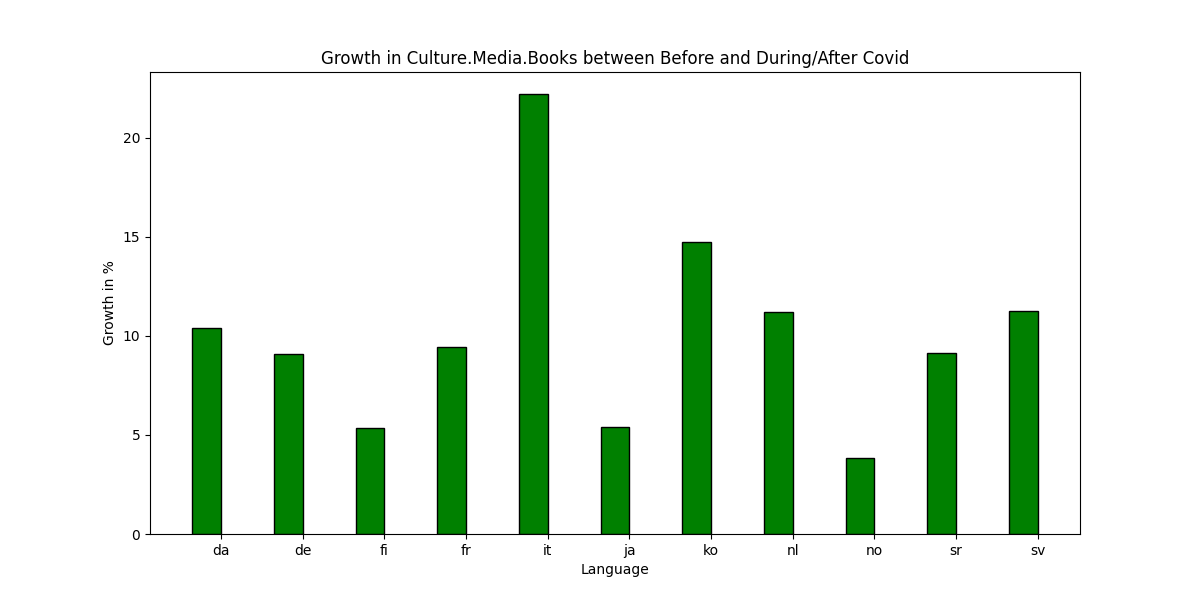
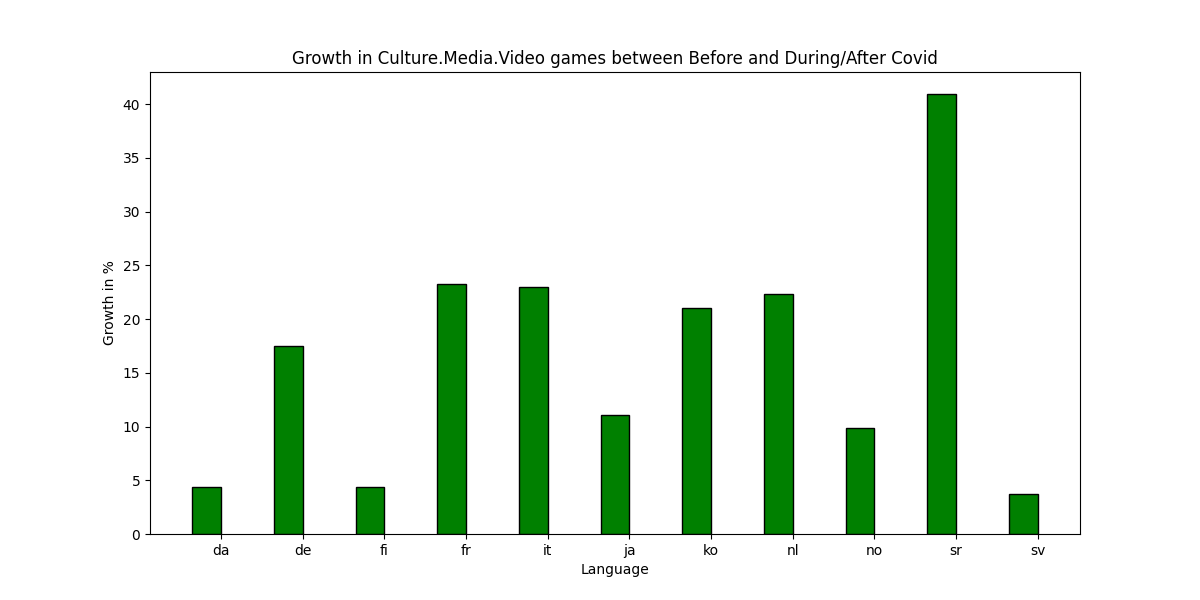
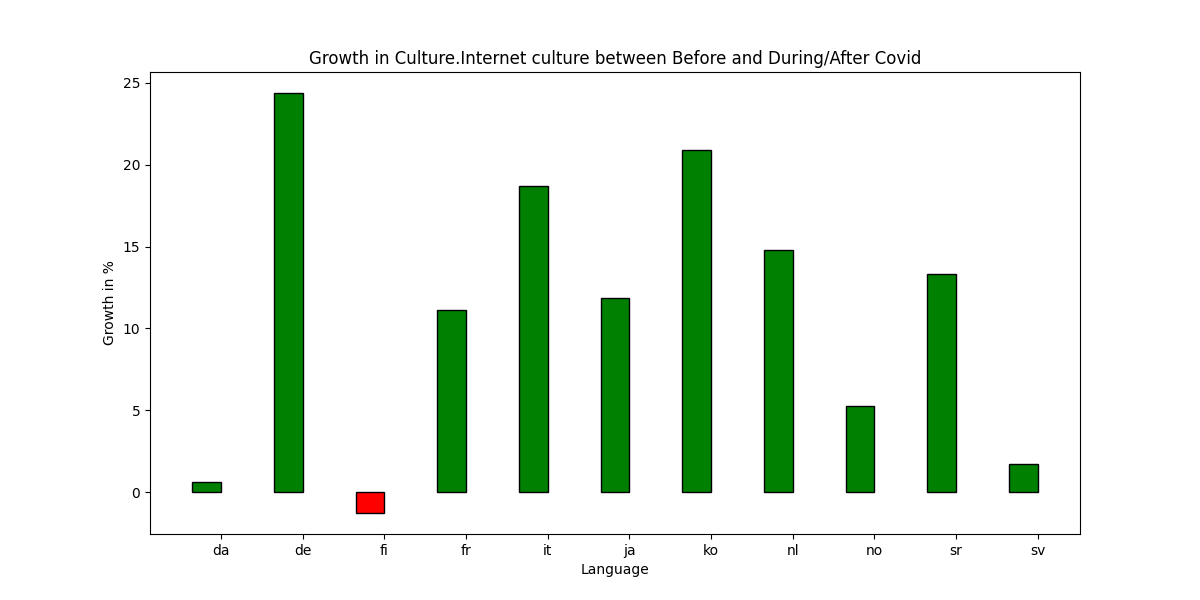
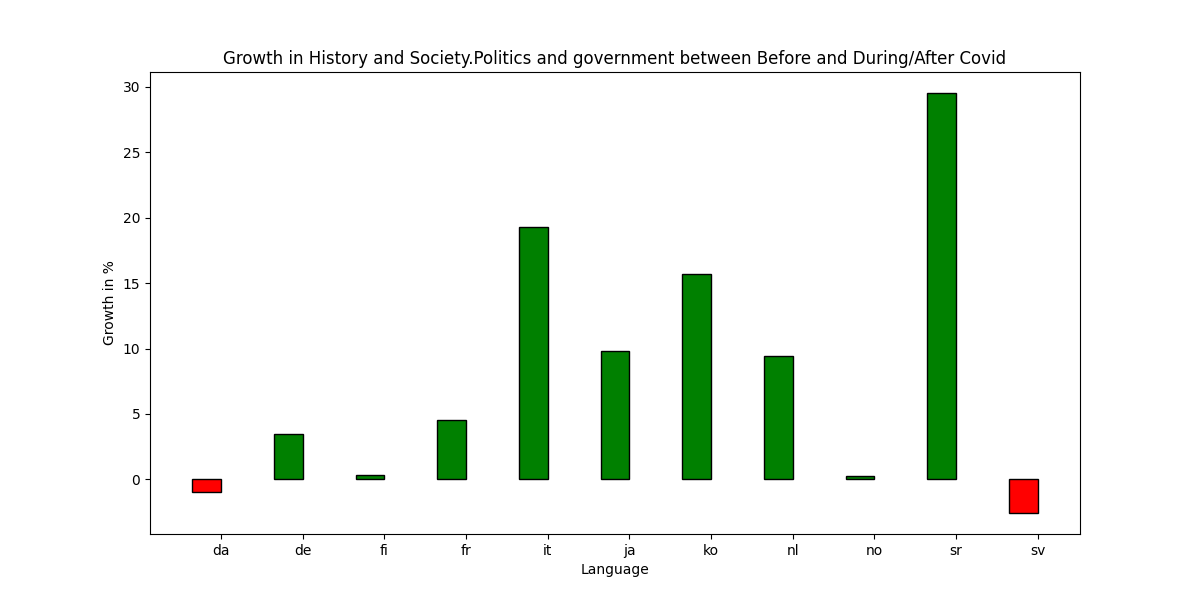
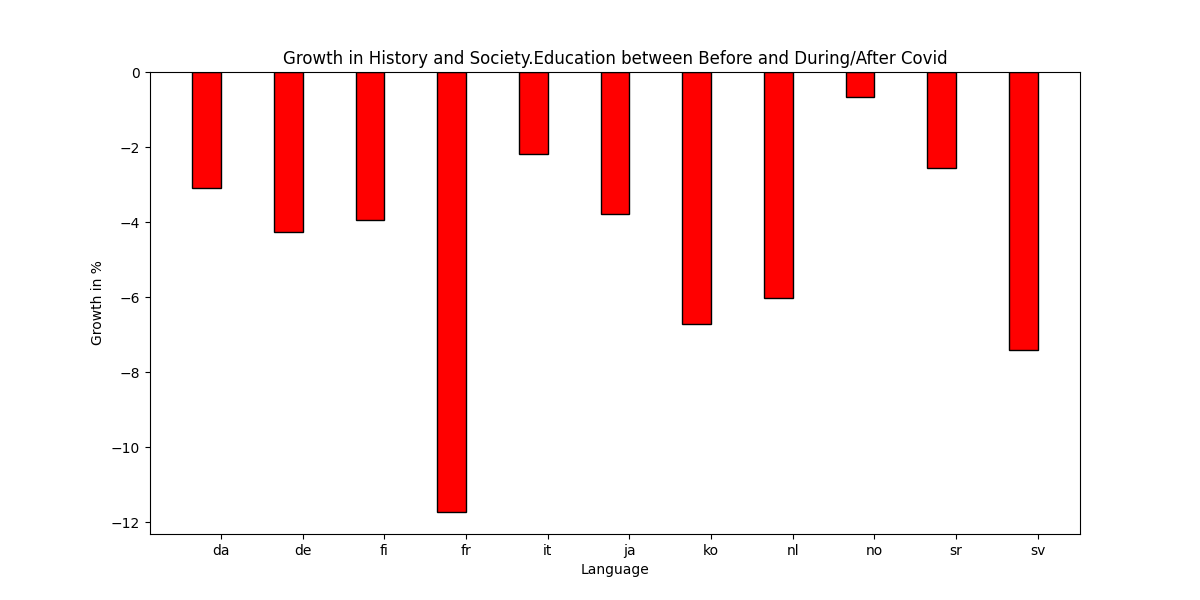
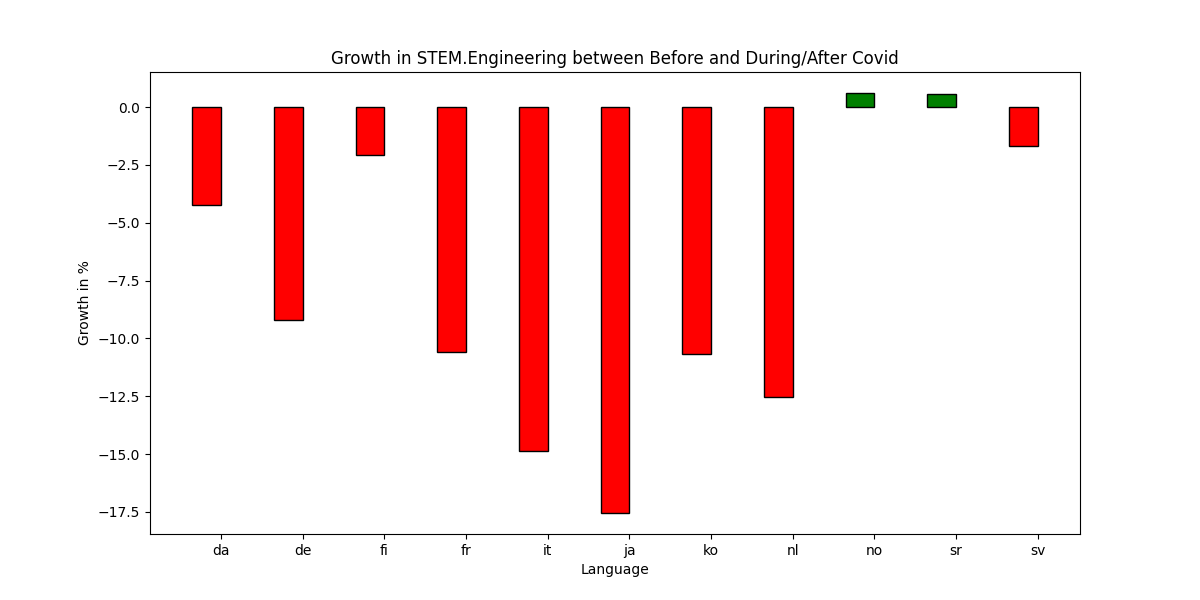
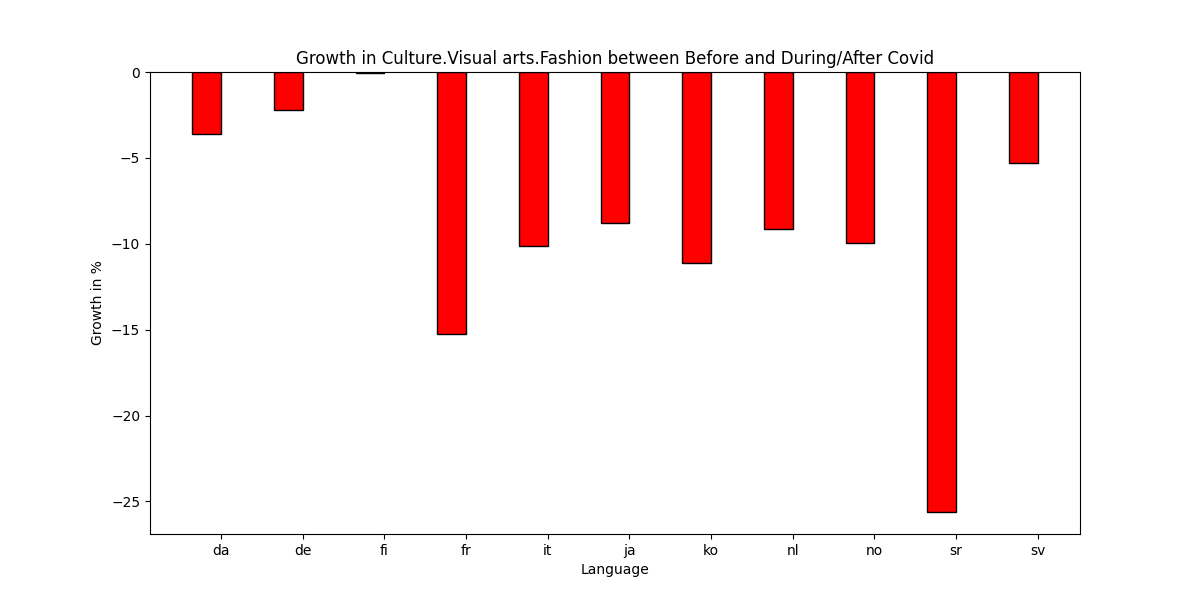
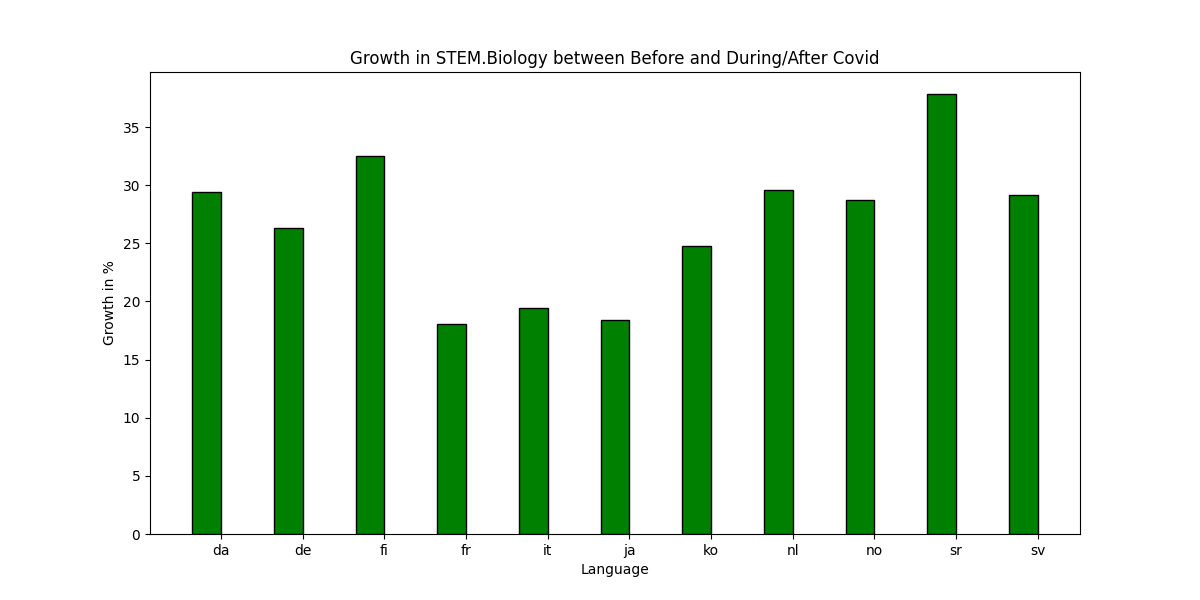
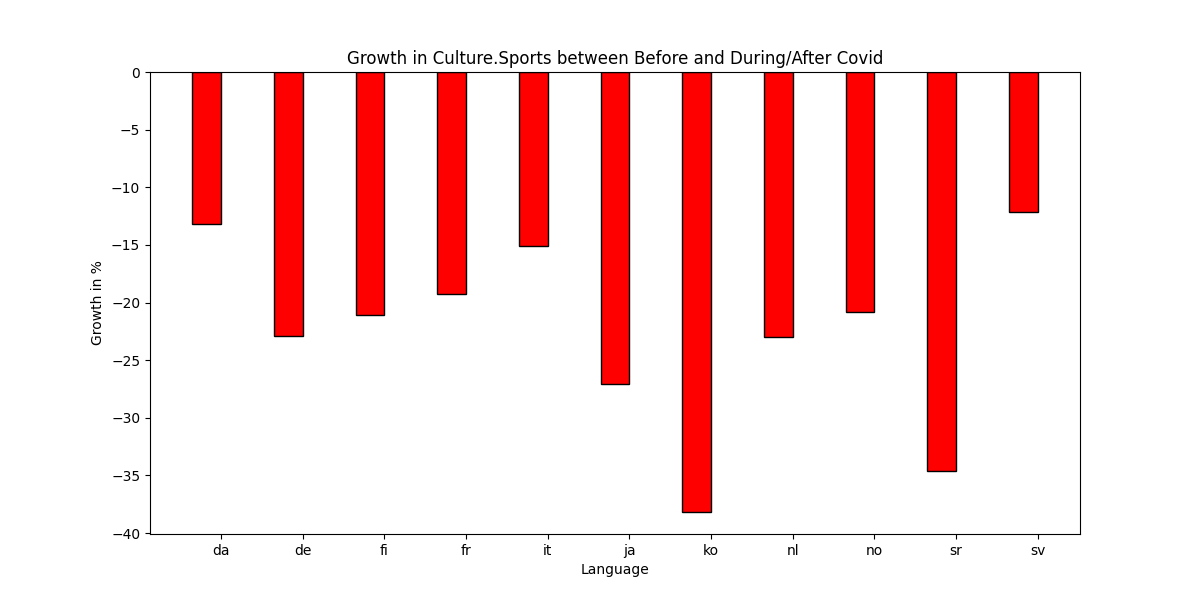
Although, there were no noticeable differences in the topics pre and post-covid, some subtopics had noticeable changes. Indeed, as shows our plot some subtopics wikipedia pages were much more visited during covid and inversely. STEM.Biology is a good example of this interest growth. In every country we studied, this subtopic had roughly a 20 % interest increase (taking into account that more people visited wikipedia pages during Covid). This makes sense as Covid is intricately linked with biology, thus covid raised interest in biology. A subtopic that we noticed received an interest decrease is Culture.Sports. Indeed, its interest decreased roughly by 20 % in every country. Again, this makes sense as most people were at home and didn’t have the opportunity to practice sport, thus it decreased their interest in sports during that period. In the following plot, we can see which subtopics received more attention and the ones that received less attention.
I want to see the increase for the following topic :
I want to see the decrease for the following topic :
Distinct Online Behavior of South Korea During the Pandemic
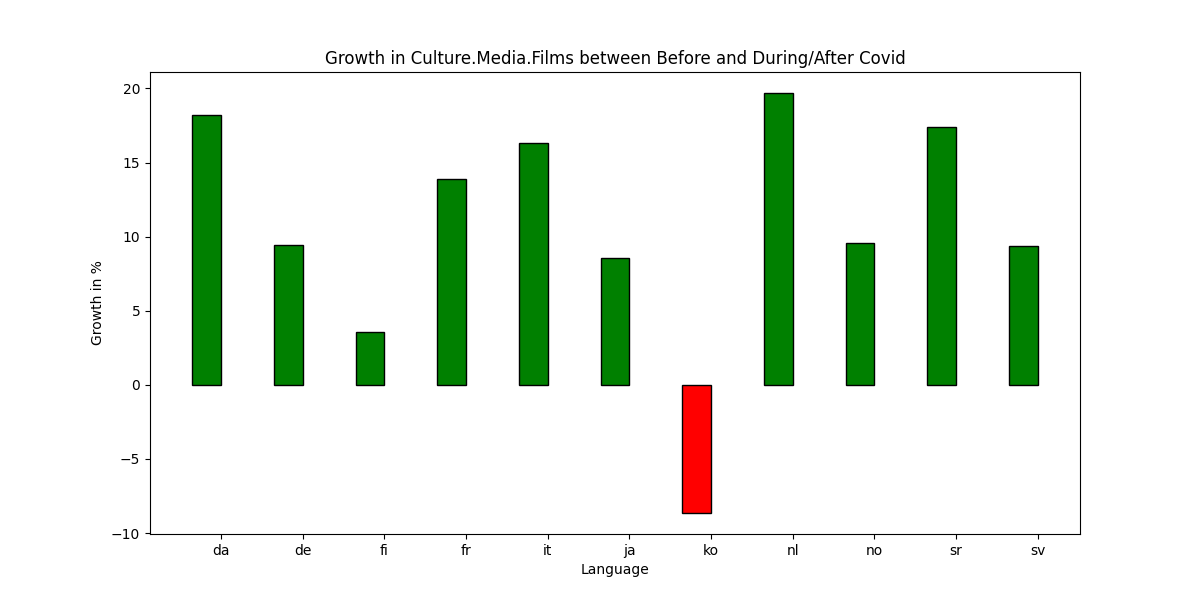
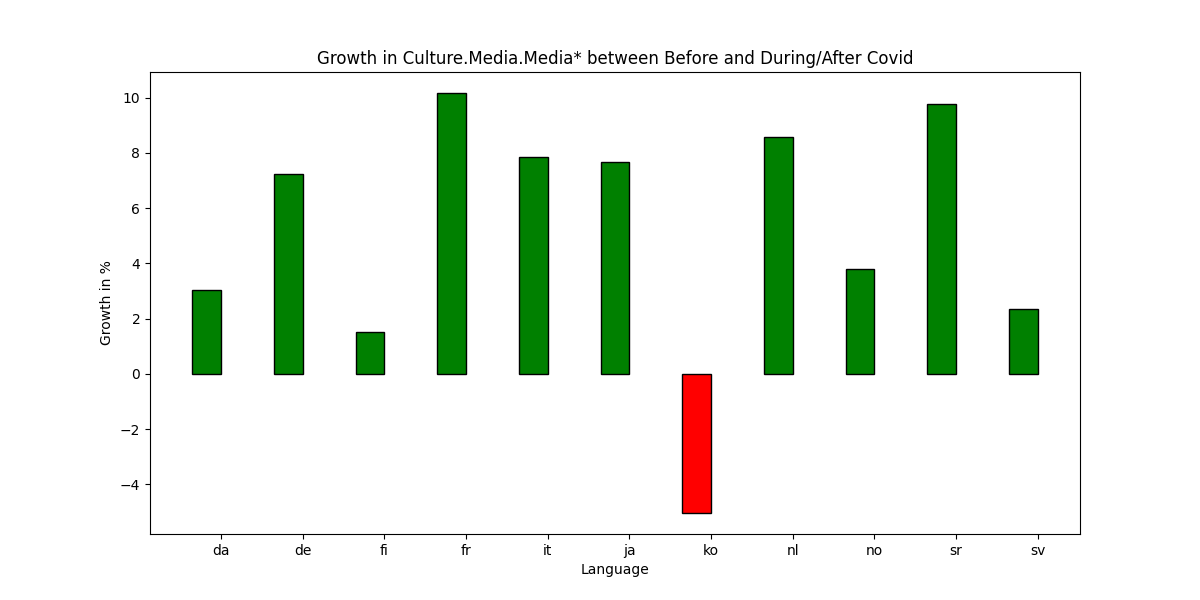
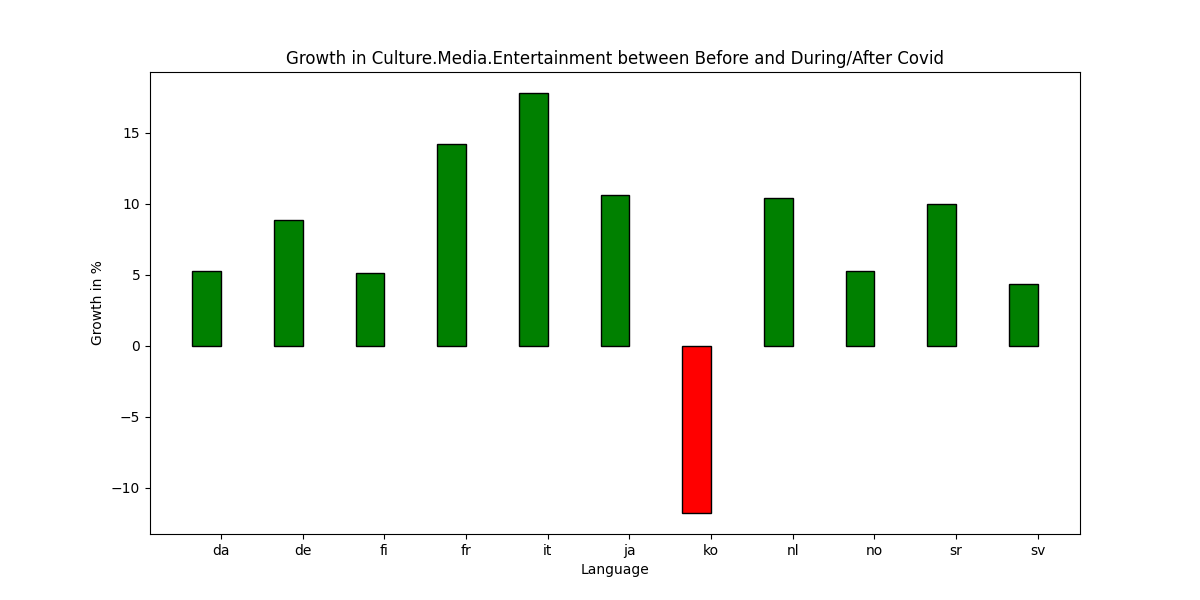
While doing our analysis, we noticed that South Korea tends to stand aside in certain subtopics. In contrast to other countries, South Korea shows less interest for “Entertainment”, “Films” and “Media” during the pandemic according to our analysis. Taking into account that South Korea didn’t have much of an “imposed” lockdown, it would make sense that the population tried to focus as much as possible on their work during what was an “uncertain time”, thus it would explain their interest deccrease in these categories. While all other countries perceived an increase in these categories, as they seeked for entertainment during the pandemic and the lockdown.
I want to see the trends for the following topic :
Consistency in Country Clusters Based on Browsing Patterns Pre and Post-COVID
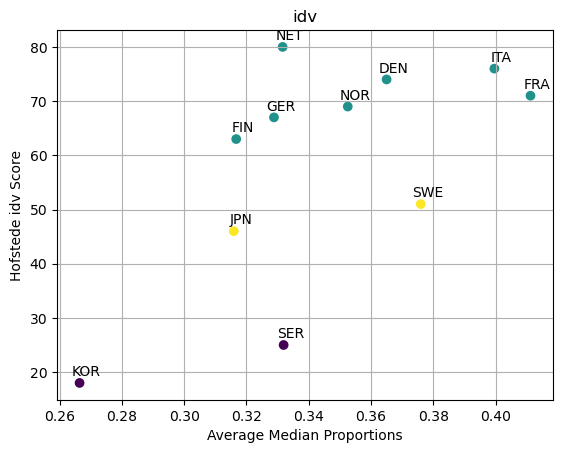
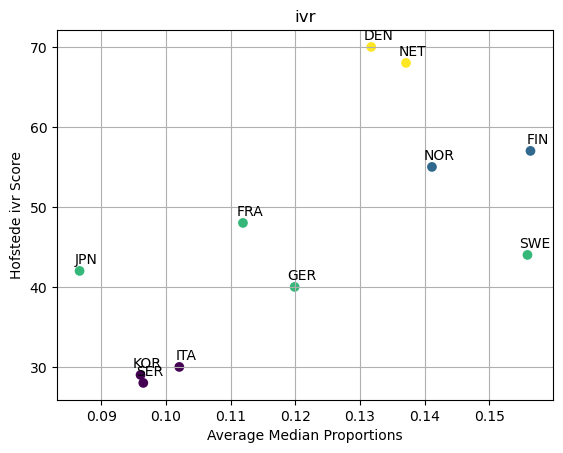
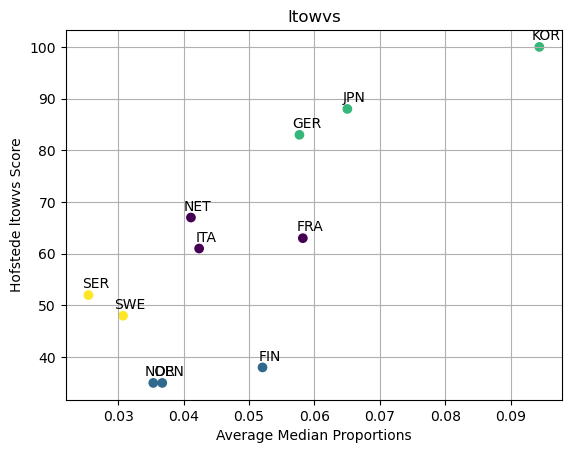
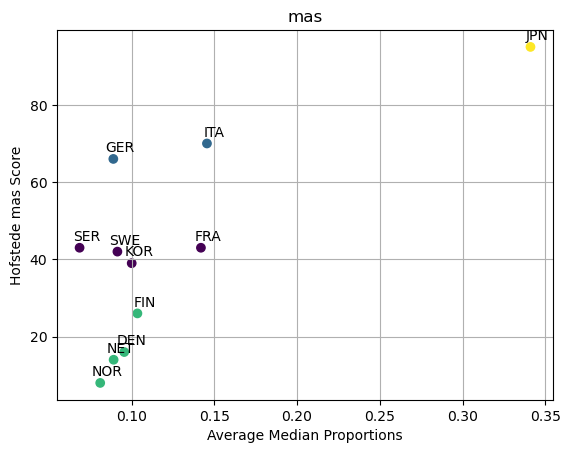
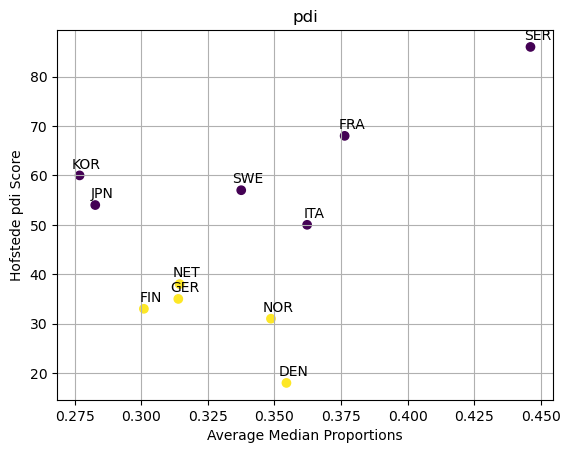
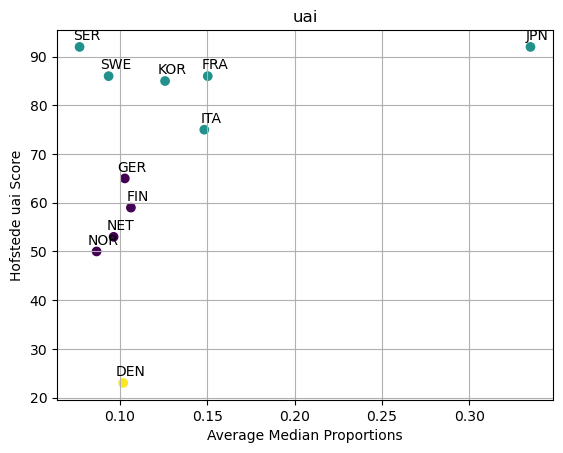
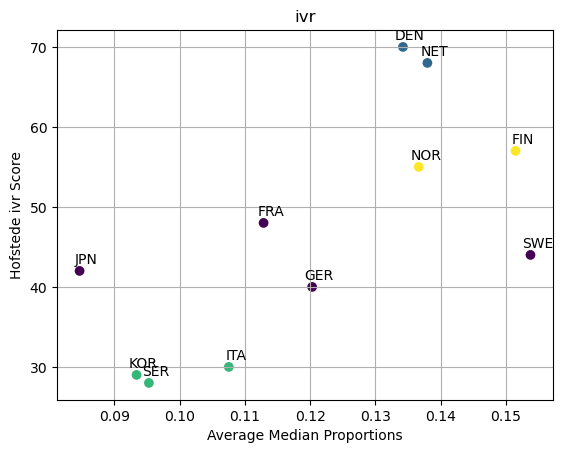
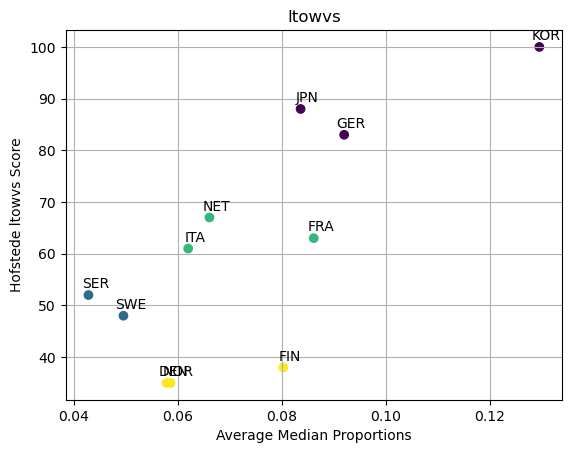
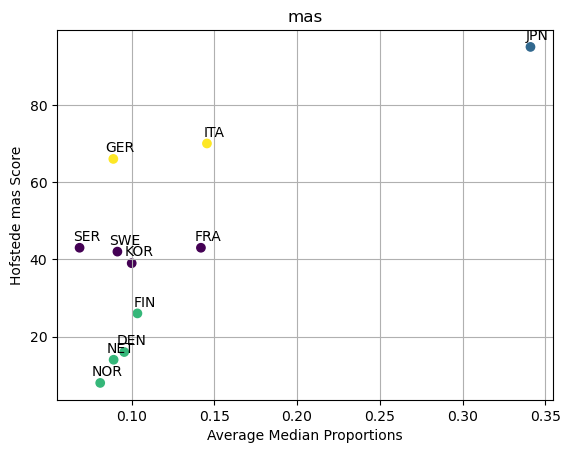
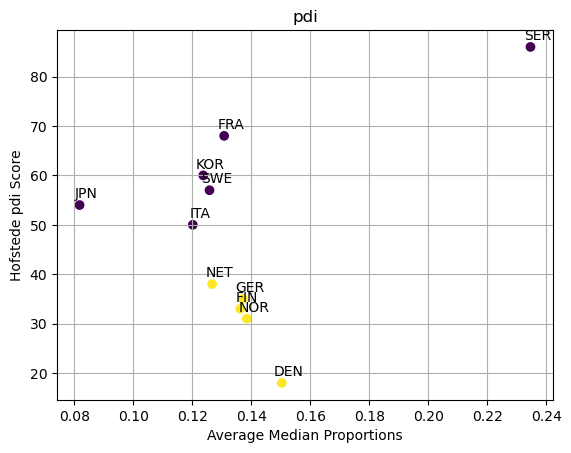
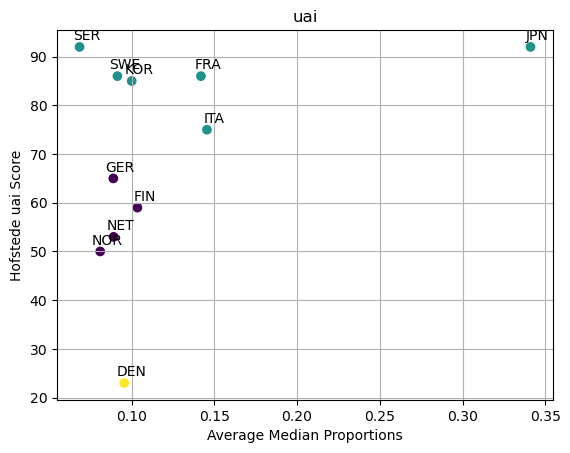
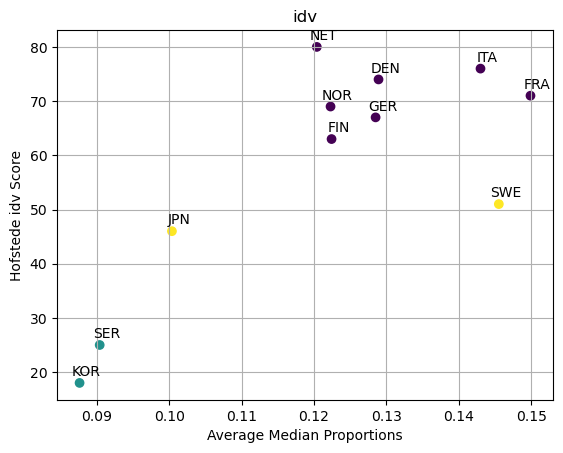
We also implemented clusters based on the countries’ browsing patterns pre and during/post covid and their Hofstede score in the different cultural aspects. We noticed that the clusters of countries remained the same in the two periods. Although some countries’ interest changed during covid, it tended to change in the same direction as the cluster it belonged to. This explains why the clusters remained the same.
I want to see the clusters for the following cultural aspect before COVID :
I want to see the clusters for the following cultural aspect during/after COVID :
